WebSocket DevTools - Complete WebSocket Traffic Control
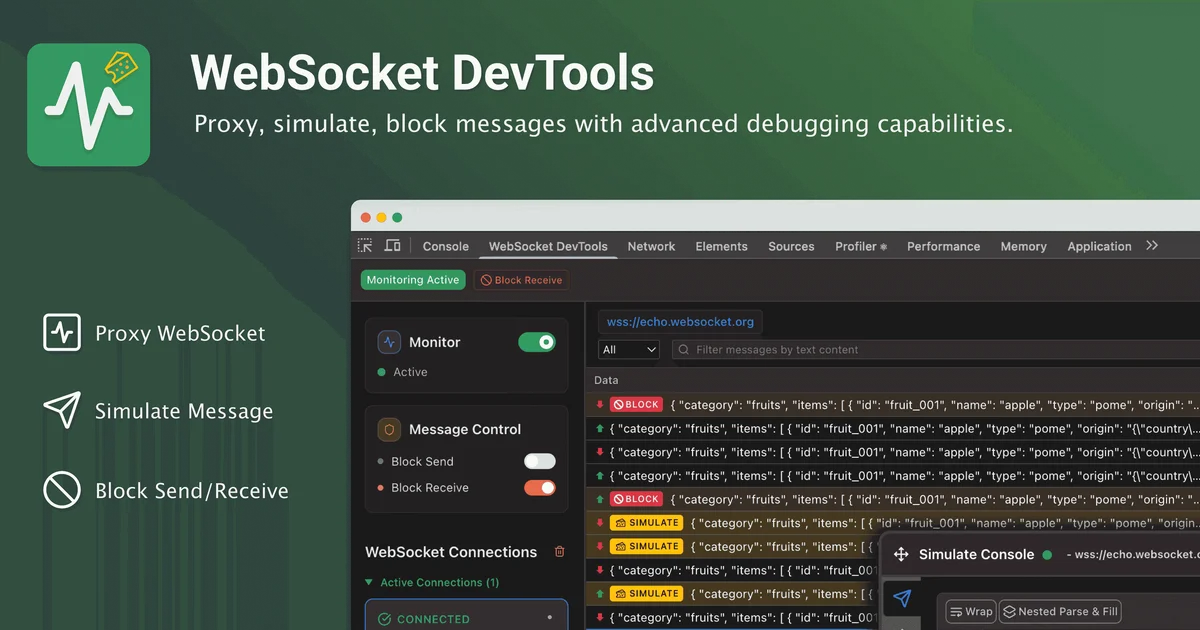
Complete WebSocket traffic control as a Chrome DevTools panel. Proxy, simulate, and block messages bidirectionally with an open-source MIT-licensed extension.
TL;DR
TL;DR: WebSocket DevTools is a free, open-source Chrome extension that puts complete WebSocket traffic control — monitor, simulate, and block messages — directly inside Chrome DevTools.
Source and Accuracy Notes
- Project page: websocket-devtools.com
- Source repository: github.com/law-chain-hot/websocket-devtools — MIT license, 1,181 stars
- Chrome Web Store: chromewebstore.google.com
- License: MIT (verified via GitHub API)
- HN launch thread: not available in current search
What Is WebSocket DevTools?
WebSocket DevTools is a Chrome (and Edge) extension that adds a dedicated WebSocket debugging panel directly into browser DevTools. Once installed, open DevTools (F12) and find the “WebSocket DevTools” tab — no separate window, no external app.
The core workflow is simple: any WebSocket connection your page makes gets captured automatically. From there you can inspect, replay, forge, and block individual messages in real time.
Setup Workflow
Step 1: Install the Extension
Chrome:
- Visit the Chrome Web Store listing
- Click “Add to Chrome” and confirm
- Open DevTools (F12) → click the “WebSocket DevTools” tab
Microsoft Edge:
- Visit the Edge Add-ons listing
- Click “Get” and confirm
- Open DevTools (F12) → “WebSocket DevTools” tab
Step 2: Start Monitoring
With the extension active, any WebSocket connection your page makes appears in the connection list. The panel shows:
- Active connections with origin and path
- Full bidirectional message history with timestamps
- JSON formatting and syntax highlighting for each message
Deeper Analysis
Background Monitoring
The panel continues capturing connections even when DevTools is minimized or the panel is closed. Messages accumulate in the background so you do not miss anything during long sessions. Reopen the panel to review the full history.
Message Simulation
Send custom messages in either direction — client-to-server or server-to-client. The simulation console supports JSON with syntax highlighting and nested parse-and-fill helpers. Useful for:
- Testing how your client handles edge-case server responses
- Replaying payloads from a recorded session
- Debugging protocol-level edge cases without a server-side test harness
Traffic Blocking
Block specific messages to test how your application behaves under malformed or missing payloads. You can also simulate connection failures and network interruptions. Each blocked message is marked clearly in the log so you can identify dropped traffic at a glance.
Favorites System
Save frequently used message templates to the favorites panel. Quick-access templates are handy for iterative testing workflows where you re-send the same payload structure with different variable values.
Iframe Support
WebSocket connections inside iframe-embedded pages are captured and proxied correctly. This matters for embedded widgets, third-party chat SDKs, and trading platforms that use iframe-based architecture.
Practical Evaluation Checklist
- Chrome + Edge support confirmed
- MIT license — auditable, no commercial restrictions
- Background monitoring (no messages lost while panel is closed)
- Bidirectional message simulation
- Message blocking with visual indicators
- JSON formatting and syntax highlighting
- Favorites system for reusable message templates
- Iframe proxy support
- No external server — runs entirely in the browser
- Open source — 1,181 GitHub stars
Security Notes
The extension runs entirely client-side inside Chrome. WebSocket traffic passes through the browser’s native WebSocket stack; the extension acts as a passive monitor and active interceptor. There is no external proxy server, so sensitive traffic never leaves your machine. As with any DevTools extension, only install from trusted sources.
FAQ
Q: Does this work with WebSocket connections over WSS (TLS)? A: Yes. The extension captures standard WSS connections in the same way as plain WS connections.
Q: Can I export message logs? A: Message history is kept in memory during the DevTools session. Use the browser’s native network log or manually copy messages for export.
Q: Is there a Firefox version? A: Currently Chrome and Edge are supported. Firefox is not listed on the store pages.
Q: Does it work with service worker-based WebSocket connections? A: It captures connections made from page context. Connections initiated inside service workers may not be captured depending on the Chrome architecture.
Q: Is the source code available for self-hosting? A: The project is open source on GitHub. You can build and load it as an unpacked extension for development purposes.
Conclusion
WebSocket DevTools fills the gap Chrome DevTools leaves around WebSocket debugging. It is free, open source, MIT licensed, and adds zero external dependencies. If you are building or debugging anything that uses WebSockets — chat apps, live dashboards, trading UIs, game servers — this extension is worth installing alongside your existing DevTools workflow.
Try it from the Chrome Web Store or read the source at github.com/law-chain-hot/websocket-devtools.
Related Posts
ai-setup
Recall – Persistent Memory for Claude Code via MCP Hooks
Recall gives Claude Code a permanent memory store that survives session restarts and context compaction. Four hooks capture and restore context automatically — with cloud SaaS or self-hosted options.
2/28/2026
dev-tools
Automotive Skills Suite for AI Engineering
Evaluate Automotive Skills Suite for APQP, ASPICE, HARA, safety-plan, and DIA workflows with setup notes, governance risks, and SME review guidance.
5/28/2026
dev-tools
awesome-agentic-ai-zh Roadmap Guide
Explore awesome-agentic-ai-zh as a Chinese agentic AI learning roadmap, with setup notes, track selection, study workflow, and evaluation guidance.
5/28/2026