Telebugs – Self-Hosted Sentry Alternative for $299
Telebugs is a one-time purchase error tracker that works with the Sentry SDKs you already use. No per-event billing, no team size limits—just Docker and your own server.
TL;DR
TL;DR: Telebugs is a self-hosted error tracker that speaks Sentry’s SDK protocol. Pay $299 once, run it on your own server, and track unlimited errors with no per-event or per-team billing.
What Is Telebugs?
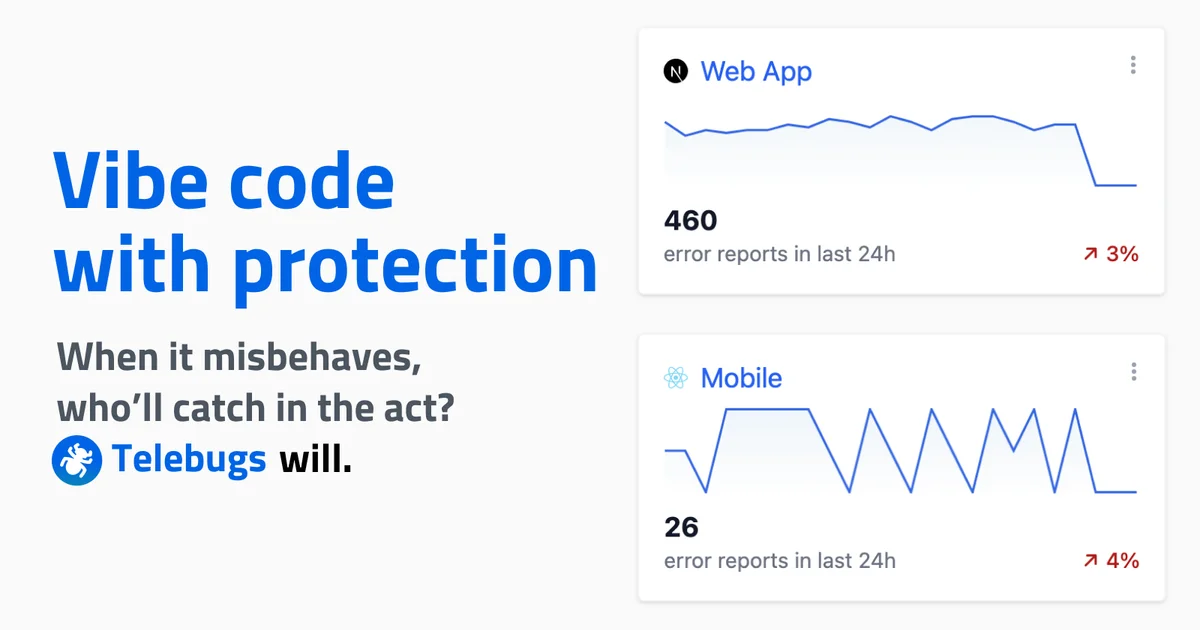
Telebugs is a drop-in, self-hosted alternative to Sentry for teams that want fixed-cost error tracking without giving up the Sentry SDK ecosystem they already use. It collects, groups, and notifies about application errors—nothing more, nothing less.
The product description on the official site says it directly:
“Telebugs is a refreshingly simple, installable error tracking system and a drop-in Sentry alternative that collects, groups, and notifies you about errors in your applications.”
Unlike hosted Sentry, Telebugs does not bill per event, per project, or per team member. The practical limit is your own server capacity and retention policy.
Setup Workflow
Step 1: Request Access to the Demo
Before buying, explore the live demo directly at telebugs.com:
- Instant access — populated, read-only demo available immediately
- Private demo — request a personal demo instance for team evaluation (usually ready the same day)
Step 2: Purchase the License
Telebugs sells a one-time license for $299 USD. What you get per license:
- Source code access after purchase
- One production domain per license
- Unlimited projects and team members on that instance
- Free 1.x updates (minor releases and fixes)
- Email support for installation, updates, and product questions
- Sentry SDK compatibility — migrate most integrations by changing the DSN
After purchase, Paddle sends a private download link and installation instructions by email.
Step 3: Install via Docker
The primary install path is Docker on a server you control:
# Pull and run the Telebugs container
docker run -d \
  --name telebugs \
  -p 3000:3000 \
  -e DATABASE_URL=your_database_url \
  telebugs/telebugs:latest
```bash

After installation, point your application's existing Sentry SDK at your Telebugs instance by updating the `SENTRY_DSN` environment variable:

```bash
# Before (Sentry cloud)
SENTRY_DSN=https://[email protected]/1234567

# After (Telebugs self-hosted)
SENTRY_DSN=https://[email protected]/projects/1
The Sentry SDK redirects to Telebugs automatically—the only change needed in most codebases is that one URL.
Step 4: Configure Notifications
Telebugs supports email-based error notifications. After setup, configure your notification channels from the Telebugs dashboard.
How Telebugs Compares to Sentry
| Feature | Telebugs | Sentry (Hosted) | Sentry (Self-Hosted) |
|---|---|---|---|
| Pricing model | One-time $299 | Per-event / per-seat | Per-seat, infrastructure cost |
| Event quotas | None | Yes (plan-dependent) | Yes |
| Team size limits | Unlimited | Yes (plan-dependent) | Yes |
| SDK compatibility | Sentry SDK | N/A | Sentry SDK |
| Scope | Errors only | Errors + performance + more | Errors + performance + more |
| Self-hosted | Yes | No | Yes |
| Docker install | Yes | N/A | Yes (large stack) |
| Update model | Free 1.x updates | Continuous | Self-managed |
Telebugs’ developer documentation explicitly frames the scope difference as intentional:
“The smaller scope is not a limitation. It is the point.”
One user migration report from the site describes the operational difference concretely:
“Going from ~60 containers, 20Gb RAM, 12 vCPUs with Sentry on-prem to a simpler, faster tool with 4Gb of RAM and 2 vCPUs has been frankly liberating.”
Source and Accuracy Notes
- Project page: telebugs.com
- License: Proprietary one-time purchase (source code provided after sale)
- HN launch thread: news.ycombinator.com/item?id=43846096
- Version covered: 1.20.0 (from site navigation)
FAQ
Q: Does Telebugs work with existing Sentry SDK integrations?
A: Yes. Telebugs speaks the Sentry ingestion protocol. Most integrations migrate by changing the SENTRY_DSN URL alone—no SDK swaps required. Projects using custom Sentry features (performance tracing, code coverage) may need additional configuration.
Q: Can I try Telebugs before buying? A: Yes. The site offers an instant read-only demo and a request form for a private demo instance. Private demos are typically available the same day.
Q: What happens after version 1.x? A: The license includes free updates for all 1.x releases. Future major versions (2.x) and their pricing are not yet announced.
Q: Is there a refund policy? A: No. Because Telebugs is downloadable source software delivered at purchase, all sales are final.
Q: Can agencies use one license for multiple clients? A: Each license covers one Telebugs instance on one production domain. Agencies often create separate projects and access rules within a single instance for each client.
Conclusion
Telebugs is a deliberate, narrow alternative to Sentry for teams that want error tracking with a fixed upfront cost and no vendor lock-in on event volume. If you are already using Sentry’s SDK and find the hosted pricing unpredictable or the self-hosted Sentry stack overbuilt for your needs, Telebugs is worth a look.
The migration story—drop from 60 containers and 20GB RAM to 4GB and 2 vCPUs—tells most of the story on its own. For a small team that just needs to know what broke and when, that is a meaningful operational reduction.
Start with the live demo at telebugs.com to see if the scope fits before committing $299.
Related Posts
ai-setup
Recall – Persistent Memory for Claude Code via MCP Hooks
Recall gives Claude Code a permanent memory store that survives session restarts and context compaction. Four hooks capture and restore context automatically — with cloud SaaS or self-hosted options.
2/28/2026
dev-tools
Automotive Skills Suite for AI Engineering
Evaluate Automotive Skills Suite for APQP, ASPICE, HARA, safety-plan, and DIA workflows with setup notes, governance risks, and SME review guidance.
5/28/2026
dev-tools
awesome-agentic-ai-zh Roadmap Guide
Explore awesome-agentic-ai-zh as a Chinese agentic AI learning roadmap, with setup notes, track selection, study workflow, and evaluation guidance.
5/28/2026