Spikelog - Simple Metrics API for Developers
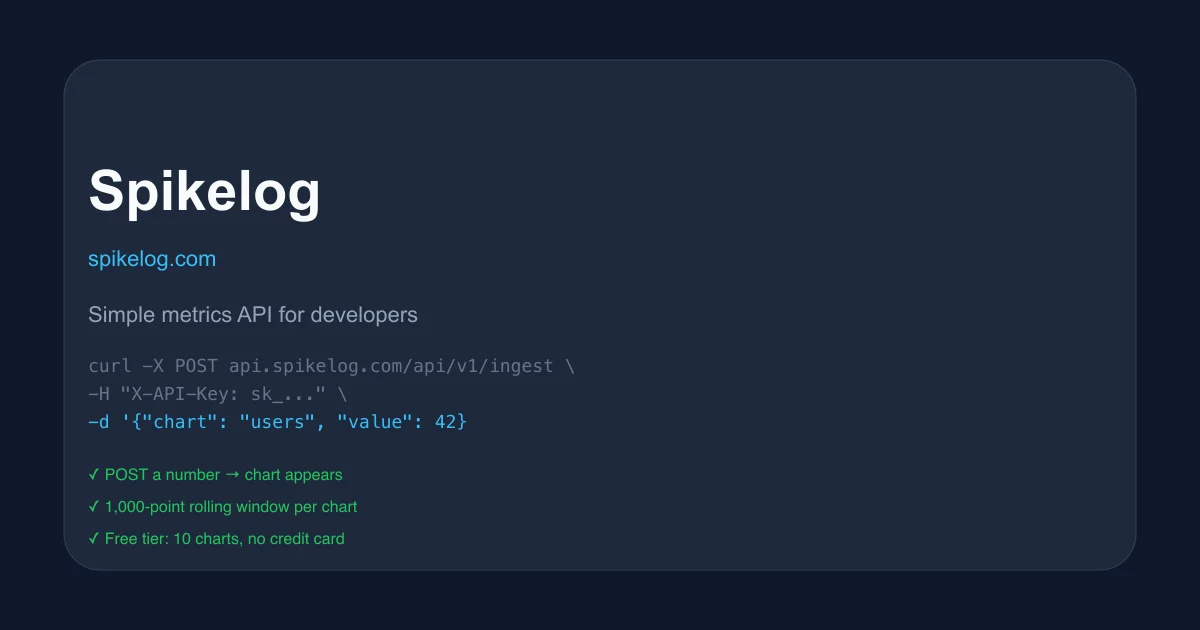
Spikelog is a dead-simple metrics service: POST a number, get a chart. No agents, no dashboards to configure, no retention settings.
TL;DR
TL;DR: Spikelog is a minimal metrics API — POST a number with a chart name and it plots it automatically. Free tier includes 10 charts with 1,000-point rolling windows.
Source and Accuracy Notes
- Project page: spikelog.com
- License: Proprietary (free tier available, no open-source repo)
- HN launch thread: news.ycombinator.com/item?id=45347914 (launched via YC W25/S26 pattern)
What Is Spikelog?
Most observability tools solve real problems — but they assume you already have infrastructure, exporters, and a DevOps team to configure them. Spikelog takes the opposite approach: strip away everything except the core primitive.
The entire product is one endpoint:
curl -X POST https://api.spikelog.com/api/v1/ingest \
  -H "X-API-Key: sk_..." \
  -d '{"chart": "users", "value": 42}'
```bash

That's it. A chart named "users" appears in your dashboard with the value 42 plotted. Send more values over time and it graphs the trend.

## Setup Workflow

### Step 1: Get an API Key

Sign in at [spikelog.com](https://spikelog.com) and create a project. Your API key is `sk_...` — you get it instantly with no verification steps.

### Step 2: Start Sending Metrics

You can POST from anywhere that speaks HTTP — a cron job, a script, a serverless function, a CI pipeline:

```bash
# Track cron job success/failure
curl -X POST https://api.spikelog.com/api/v1/ingest \
  -H "X-API-Key: sk_your_key" \
  -d '{"chart": "deployments", "value": 1}'

# Track a business metric
curl -X POST https://api.spikelog.com/api/v1/ingest \
  -H "X-API-Key: sk_your_key" \
  -d '{"chart": "daily-revenue", "value": 842}'
Step 3: View Charts
Charts appear automatically under your project dashboard at spikelog.com/dashboard. No configuration, no layout builder.
Deeper Analysis
What makes it different
Zero-configuration observability. Grafana, Prometheus, and Datadog all require some upfront work: install agents, define metrics schemas, set up dashboards. Spikelog skips all of that. The first POST creates the chart.
AI-friendly. The API is simple enough that a coding agent can drive it. The HN launch post mentions a Cursor prompt that automatically identifies places in a codebase to add counters. This is genuinely useful for engineers who want lightweight telemetry without a full observability setup.
Constraint as feature. 10 charts max, 1,000 points per chart, rolling window only. These constraints aren’t bugs — they force simplicity. You don’t configure retention policies or tier storage; old points just roll off.
Pricing
Free tier: 10 charts, 1,000-point rolling window per chart, no credit card.
No paid tier is documented on the site as of launch, but the product is clearly built for individual developers and side projects. A paid tier with more charts or longer retention would be a natural next step.
What it’s not
Spikelog is not a replacement for Datadog, Grafana, or even a simple Prometheus setup if you need:
- Complex queries across multiple metrics
- Alerting with threshold rules
- High cardinality dimensions
- Compliance-grade retention
The comparison section of the site is refreshingly honest: “Need complex queries or compliance? Use Axiom. Just want to track a few numbers over time? Use Spikelog.”
Practical Evaluation Checklist
- API simplicity: Single POST endpoint, no SDK required — test in 30 seconds with curl
- No infrastructure: Completely hosted, no agents to install
- AI compatibility: The API is JSON over HTTP, trivially callable from any LLM agent
- Constraint-aware: Designed for small projects, not enterprise scale
- Developer onboarding: Sign up, get key, POST — three steps, no docs needed for basic use
Security Notes
- API keys (
sk_...) are sent as request headers — not in URL query strings - Keys are per-project, making revocation straightforward
- No mention of SOC 2, encryption at rest, or data processing agreements — not a fit for regulated industries
FAQ
Q: Can I set alerts when a metric crosses a threshold? A: Not yet. The site lists “Simple threshold alerts” as a coming feature. For now, you’d need to poll the API yourself or use an external monitor.
Q: What happens when I hit 1,000 points? A: Old data rolls off automatically — the oldest point is dropped when a new one arrives. There is no retention configuration.
Q: Is there a Python or JavaScript SDK? A: No SDK is documented. The API is simple enough to call directly with standard library requests or fetch. The site shows examples in cURL, Python, TypeScript, JavaScript, Go, and Rust.
Q: Can I track multiple values in one POST?
A: No — each POST sends one (chart, value) pair. The design intentionally keeps the API minimal.
Q: What’s the data format?
A: A JSON object with chart (string name) and value (number). Optional tags are mentioned but described as untested.
Conclusion
Spikelog solves the “I just want to see this number over time” problem with minimal ceremony. It is not trying to be Datadog — it is explicitly not trying to be Datadog. For scripts, cron jobs, MVPs, and side projects where you need one chart without deploying an observability stack, it is probably the right tool.
The AI-friendly design is the real bet: as AI coding agents become more common in development workflows, an API that any agent can call without setup friction has a real niche. Worth trying if your metric tracking needs are simple.
HN Thread: Show HN: Spikelog – A simple metrics service for scripts, cron jobs, and MVPs
Related Posts
ai-setup
Recall – Persistent Memory for Claude Code via MCP Hooks
Recall gives Claude Code a permanent memory store that survives session restarts and context compaction. Four hooks capture and restore context automatically — with cloud SaaS or self-hosted options.
2/28/2026
dev-tools
Automotive Skills Suite for AI Engineering
Evaluate Automotive Skills Suite for APQP, ASPICE, HARA, safety-plan, and DIA workflows with setup notes, governance risks, and SME review guidance.
5/28/2026
dev-tools
awesome-agentic-ai-zh Roadmap Guide
Explore awesome-agentic-ai-zh as a Chinese agentic AI learning roadmap, with setup notes, track selection, study workflow, and evaluation guidance.
5/28/2026