OpenTrace – Give Your AI Coding Agent Eyes on Production
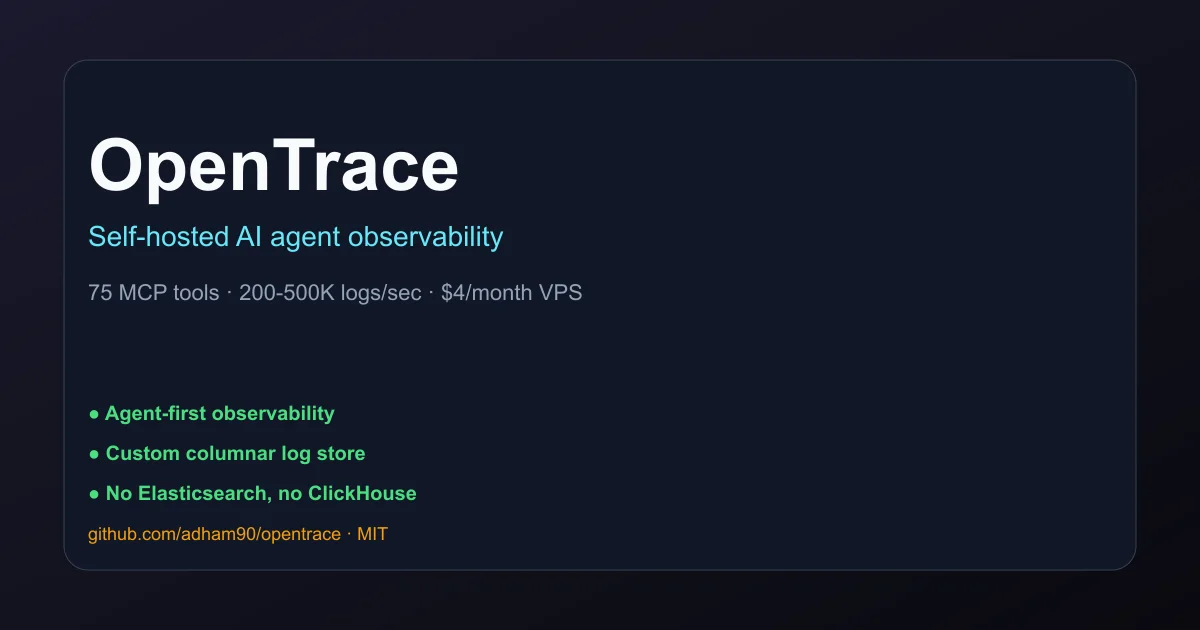
OpenTrace connects Claude Code and Cursor directly to your production observability data via MCP. Self-hosted, no Elasticsearch, runs on a $4/month VPS.
TL;DR
TL;DR: OpenTrace is a self-hosted observability server that gives AI coding agents direct access to production logs, errors, and database queries via 75 MCP tools — no dashboards, no copy-pasting, the agent queries everything itself.
Source and Accuracy Notes
- Project page: opentrace.ai ← verified via README
- Source repository: github.com/adham90/opentrace ← README read in full
- License: MIT ← verified
- HN launch thread: news.ycombinator.com/item?id=47160164
- Stars: 15 (GitHub API verified)
What Is OpenTrace?
Your AI coding assistant can read your code — but it is blind to production. When something breaks, you copy-paste stack traces, dig through log dashboards, and manually feed context into chat.
OpenTrace fixes that. It is a self-hosted server that connects your AI agent directly to your production observability data via MCP. No dashboards, no UI — the agent is the interface.
You:    "Why is the checkout endpoint throwing 500s?"

Agent:  Error rate on POST /api/checkout spiked from 0.1% to 4.2%
        starting 8 minutes ago. 23 errors, 12 affected users.

        Root cause: NilPointerError at payments_controller.rb:87
        — customer.address is nil when charging.

        This started after the latest deploy (commit a1b2c3d by
        [email protected]). The commit modified payments_controller.rb
        lines 82-95.

        Want me to fix it?
```bash

## Setup Workflow

### Step 1: Deploy the server

Pick one method:

**VPS (Hetzner, DigitalOcean, any Linux server):**

```bash
ssh root@your-server
curl -fsSL https://raw.githubusercontent.com/adham90/opentrace/main/scripts/install.sh | bash
```bash

The installer downloads the latest binary, initializes the database, sets up a systemd service, and optionally installs Caddy for automatic HTTPS.

**Docker:**

```bash
docker run -d --name opentrace \
  -p 8080:8080 \
  -v opentrace-data:/data \
  -e OPENTRACE_LISTEN_ADDR=0.0.0.0:8080 \
  ghcr.io/adham90/opentrace:latest
```bash

**Docker Compose:**

```bash
docker compose -f docker-compose.prod.yml up -d
```bash

One-click deploys are also available for Railway, Render, and DigitalOcean.

### Step 2: Connect your project

```bash
curl -s https://your-server.com/connect | bash
No client install needed. The script creates .mcp.json in your project — Claude Code reads this file and connects to OpenTrace automatically.
Step 3: Set up the SDK
Open Claude Code and ask:
“Set up opentrace for my project”
The agent detects your framework, installs the SDK, configures it with the correct API key, and verifies logs are flowing.
| SDK | Platform | Install |
|---|---|---|
| opentrace | Ruby / Rails | gem 'opentrace' |
| @opentrace-sdk/node | Node.js | npm install @opentrace-sdk/node |
Step 4: Start asking your agent
You are done. Example questions the agent can answer:
| Question | What happens |
|---|---|
| What errors are happening in production? | Agent searches error groups, shows impact and stack traces |
| Why is the payments endpoint slow? | Agent checks request performance — duration, SQL count, external API time, N+1 detection |
| Show me logs from the last hour with level ERROR | Agent searches logs with columnar filters |
| Is it safe to deploy this change? | Agent checks blast radius, code risk scores, recent errors |
| Set up a watcher for checkout error rate above 1 percent | Agent creates a threshold alert |
Deeper Analysis
Storage Engine
OpenTrace uses a custom segmented columnar log store instead of SQLite or Elasticsearch for log data:
- Write path: SDK sends flat JSON → server appends to binary WAL → fsync. No indexes on write. 200–500K entries per second.
- Seal: Every hour, the WAL is sealed into compressed columnar chunks (45 columns, 6 encoding types: dictionary, sparse, delta, bitpack, varint, zstd). 3–5MB peak memory.
- Query: Parallel column scans across segments plus custom inverted index for full-text search. Most queries complete in 5–50ms.
- Pruning:
rm -rfold segment directories. Instant — no DELETE queries, no VACUUM. - Storage: roughly 76MB per hour at 1M logs per hour. Fits on a $4 VM.
MCP Tools
OpenTrace exposes 13 tools with 90+ actions via MCP. Each tool returns suggested_tools with pre-filled arguments so the agent knows what to call next.
| Tool | Actions | What it does |
|---|---|---|
| logs | search, context, attributes, stats, summary, performance, trace, compare | Full-text log search, distributed trace assembly, N+1 detection |
| errors | list, detail, investigate, impact, user_errors, ranking, resolve, ignore, reopen, new | Error grouping by fingerprint, user impact scoring, stack traces |
| database | queries, explain, tables, activity, locks, connections, indexes, schema, storage, kill_query, long_transactions | Postgres introspection, EXPLAIN plans, lock and connection analysis |
| watches | status, create, delete, alerts, dismiss, acknowledge, investigate | Threshold alerts on error rate, latency, request volume |
| overview | status, triage, diagnose, timeline, investigate, changes, settings, notes, delete_note | System health, alerts, incident timeline, settings, agent memory |
| analytics | traffic, endpoints, heatmap, trends, movers | Traffic patterns, endpoint performance, time-series analysis |
| code | risk, fragile, annotate_file, annotate_function, hotspots, gen_context, gen_suggest, deps_service, deps_blast, deps_risk | Code risk scores, test generation, blast radius, production annotations |
| deep_capture | request_capture, sql_captures, http_captures, email_captures, audit_trail, search_audit, search_sql, file_captures, get_pii_config, update_pii_config, get_retention, update_retention | Per-request deep capture: SQL, HTTP, emails, audit trail, file ops, PII config |
| healthchecks | list, uptime, create, delete | HTTP endpoint monitoring with uptime tracking |
| servers | list, query, health | Server and process metrics (CPU, memory, GC) |
| connectors | list, get, create, test, update, delete | Manage database connectors (Postgres, MySQL, etc.) |
| setup | status, detect, guide, verify | SDK setup assistant — detects framework, provides config with API key |
| admin | update_retention, users, update_role, toggle_active, delete_user, audit | User management, retention, audit log (admin only) |
Security Notes
| Protection | How |
|---|---|
| No self-registration | First curl .../connect creates admin. Everyone else needs an invite. |
| Per-user tokens | Each developer gets a personal MCP token, stored in their local .mcp.json. Revocable independently. |
| HTTPS via Caddy | The install script sets up Caddy with automatic Let us Encrypt certificates. |
| PII scrubbing | Credit cards, emails, phone numbers, SSNs, and configurable sensitive fields are scrubbed from request bodies before storage. |
| Rate limiting | Auth endpoints are rate-limited — 10 attempts per minute per IP. |
| Read-only DB access | All queries against your Postgres are validated SELECT-only via SQL AST parsing. |
| API key auth | SDK log ingestion requires a Bearer token. |
| No telemetry | Fully self-hosted. No external calls. No tracking. Your data stays on your server. |
Practical Evaluation Checklist
- Deploy on a $4–$6 VPS (Hetzner, DigitalOcean) or use Docker Compose
- Run
curl https://your-server.com/connect | bashin a project with Claude Code or Cursor - Verify
.mcp.jsonis created and agent auto-connects - Ask the agent “What errors are happening in production?” and confirm it returns real data
- Try “Why is the checkout endpoint slow?” against a live endpoint with the SDK installed
- Verify PII scrubbing by sending a test log with an email and checking it is not stored in plain text
- Test rate limiting by hitting the auth endpoint more than 10 times per minute
FAQ
Q: Does it require a separate database like PostgreSQL? A: No. OpenTrace uses its own custom columnar storage engine for log data and SQLite for platform data (users, watches, error groups). Your Postgres is only touched when you explicitly connect it as a data source for the agent to query.
Q: How much resources does the server need? A: The README states it runs on a $4/month VM. The custom columnar storage uses roughly 76MB per hour at 1M logs per hour with 3–5MB peak memory during hourly segment seals.
Q: Does it work with Claude Code and Cursor?
A: Yes. Both read .mcp.json and auto-connect via MCP. The SDK supports Ruby/Rails and Node.js. Other frameworks can send structured JSON logs directly via the HTTP ingest endpoint.
Q: Is there a hosted or cloud version? A: No. OpenTrace is fully self-hosted. There is no cloud offering and no external telemetry — all data stays on your server.
Conclusion
OpenTrace solves a real problem: AI coding agents are blind to production. By exposing observability data through MCP tools, it lets the agent do the debugging work — investigating errors, checking SQL performance, assessing deploy risk — without you copy-pasting logs or switching to a dashboard.
The custom columnar storage engine is the standout technical detail. No Elasticsearch, no ClickHouse, no heavy dependencies — just a Go binary and a $4 VPS. That makes it genuinely practical for indie developers and small teams who want agent-first debugging without managing a full observability stack.
If you run Claude Code or Cursor on production projects, OpenTrace is worth a spin. The connect flow takes under five minutes.
Source and Accuracy Notes
- Project page: opentrace.ai
- Source repository: github.com/adham90/opentrace
- License: MIT (verified via
LICENSEfile in repository) - HN launch: news.ycombinator.com/item?id=47160164
- Stars: 15 (GitHub API
stargazers_countverified) - Topics: alerting, claude, cursor, database-monitoring, debugging, devtools, full-text-search, golang, log-management, logging, mcp, mcp-server, model-context-protocol, monitoring, observability, open-source, postgres, self-hosted, sqlite
Related Posts
ai-setup
Recall – Persistent Memory for Claude Code via MCP Hooks
Recall gives Claude Code a permanent memory store that survives session restarts and context compaction. Four hooks capture and restore context automatically — with cloud SaaS or self-hosted options.
2/28/2026
dev-tools
Automotive Skills Suite for AI Engineering
Evaluate Automotive Skills Suite for APQP, ASPICE, HARA, safety-plan, and DIA workflows with setup notes, governance risks, and SME review guidance.
5/28/2026
dev-tools
awesome-agentic-ai-zh Roadmap Guide
Explore awesome-agentic-ai-zh as a Chinese agentic AI learning roadmap, with setup notes, track selection, study workflow, and evaluation guidance.
5/28/2026