Microsoft Flint: A Visualization Language for AI Agents
MIT-licensed visualization language from Microsoft that compiles simple chart specs into Vega-Lite, ECharts, and Chart.js, with an MCP server for AI agents.
TL;DR
TL;DR: Microsoft Flint is an MIT-licensed visualization intermediate language that lets AI agents produce expressive charts from simple, human-editable specs, compiling to Vega-Lite, ECharts, or Chart.js. It ships with an MCP server so agents can author, validate, and render charts directly from a chat or coding environment.
Source and Accuracy Notes
- Project page: microsoft.github.io/flint-chart
- Source repository: github.com/microsoft/flint-chart
- License: MIT (verified via GitHub API
license.spdx_id) - Latest release: v0.3.0 (2026-07-19)
- HN launch thread: news.ycombinator.com/item?id=48834924
What Is Flint?
Flint is a visualization intermediate language built by Microsoft Research. Instead of asking an AI agent to write verbose Vega-Lite or ECharts configuration by hand — tuning scales, axes, spacing, labels, and layout — Flint accepts a simple, compact chart spec and the compiler derives all the tedious details automatically.
The key abstraction is semantic types (70+ of them: Rank, Temperature, Price, Country, etc.). When you tell Flint that a field is Quantity rather than just number, the compiler makes smarter layout decisions.
Flint ships two main packages:
flint-chart— JavaScript/TypeScript libraryflint-chart-mcp— MCP server for agentic use
Supported Backends
One Flint spec compiles to native output for:
Chart Types
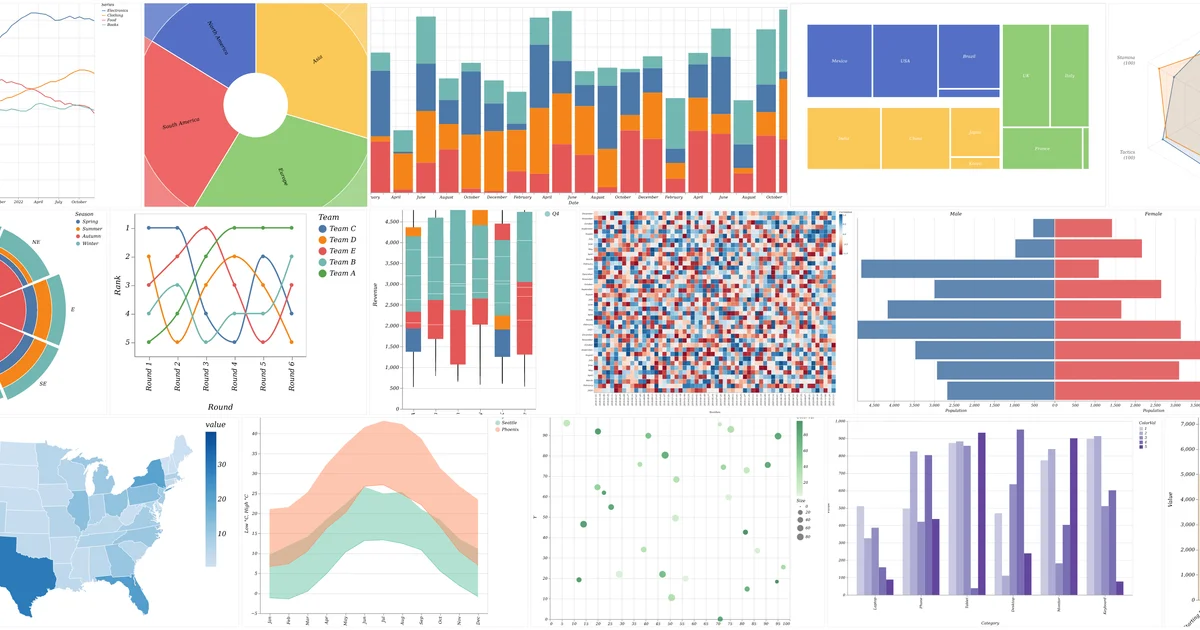
Bar, line, scatter, heatmap, donut, radar, streamgraph, boxplot, grouped bar, rose, Sankey, treemap, and more — across all three backends from a single input.
Setup Workflow
Step 1: Install the Library
npm install flint-chart
```bash

### Step 2: Use Flint As a Library

```ts
import { assembleVegaLite } from 'flint-chart';

const spec = assembleVegaLite({
  data: { values: myData },
  semantic_types: { weight: 'Quantity', mpg: 'Quantity', origin: 'Country' },
  chart_spec: {
    chartType: 'Scatter Plot',
    encodings: { x: { field: 'weight' }, y: { field: 'mpg' }, color: { field: 'origin' } },
    baseSize: { width: 400, height: 300 },
  },
});
// → a ready-to-render Vega-Lite spec
```bash

Swap the backend without changing the input shape:

```ts
import { assembleECharts, assembleChartjs } from 'flint-chart';
```bash

### Step 3: Run the MCP Server for AI Agents

```bash
npx -y flint-chart-mcp
This starts an MCP server that gives AI agents tools to create, validate, and open interactive chart views. Clients that support MCP (e.g., Claude Desktop, Cursor, Windsurf) can then invoke Flint directly from conversation.
Deeper Analysis
Why Semantic Types Matter
Traditional visualization grammars require the author to know chart design details: bin widths, axis tick intervals, color scale ranges, legend placement. This is noise that clutters prompts and produces inconsistent output when an LLM generates the spec.
Flint shifts that burden to the compiler. By tagging fields with semantic types, the agent only says what the data means, not how to draw it. The 70+ semantic types cover common data roles — Rank, Temperature, Price, Country, Currency, Percentage, Latitude, Longitude, and so on.
MCP Server Integration
The flint-chart-mcp package is what makes Flint agent-ready out of the box. An agent can:
- Choose a chart template from the Flint catalog
- Pass in data and semantic type annotations
- Get back a rendered chart in a interactive view
- Validate the spec before rendering
This closes the loop between natural-language instruction and the final rendered output, without the agent needing to know the target library’s API.
Recent Releases
| Version | Date | Highlights |
|---|---|---|
| v0.3.0 | 2026-07-19 | Dynamic chart widgets — switch chart types and edit properties in place |
| v0.2.2 | 2026-07-15 | Compact dodge modes, grouped violin layouts |
| v0.2.1 | 2026-07-13 | Chart property validation, backend consistency |
Practical Evaluation Checklist
-
npm install flint-chartcompletes without errors - Basic scatter plot compiles to Vega-Lite spec (verify output keys:
$schema,mark,encoding) - Same spec swaps to ECharts with
assembleECharts - MCP server starts with
npx -y flint-chart-mcpand responds to tools list - Semantic type annotations affect output (compare
Quantityvs barenumberon same field) - Chart wall renders in browser from generated specs
Security Notes
flint-chartandflint-chart-mcpare published to npm (verified package name)- MCP server runs locally — no data leaves your environment unless you configure it to
- No known CVEs at time of writing (v0.3.0, July 2026)
- Review the security policy before using in production environments
FAQ
Q: Does Flint work with Python? A: Not yet. The current Python implementation is a source-only preview in the repo. JavaScript/TypeScript is the primary language.
Q: What makes Flint different from PromptPie or other chart tools? A: Flint is an intermediate language, not a hosted service. It targets developers and AI agents that want to embed chart rendering in their own pipelines. It also compiles to multiple backends simultaneously, so you are not locked into one rendering library.
Q: Can I use Flint without an MCP client?
A: Yes. The flint-chart library works standalone in any Node.js project.
Q: Is this production-ready? A: The project is in active development (v0.3.0 as of July 2026). Review the changelog and test in your environment before adopting for critical paths.
Conclusion
Flint solves a real pain point in AI-assisted data visualization: agents that need to produce polished charts but lack the hard-won knowledge of visualization grammars. By surfacing semantic intent instead of rendering details, it makes chart authoring reliable enough for automated pipelines.
If you are building AI agents that work with data — or just want a smarter chart compiler for your frontend — Flint is worth a look. The MCP server integration is the fastest path to getting an agent to produce real visualizations from natural language.
Install it with npm install flint-chart, or spin up the MCP server with npx -y flint-chart-mcp.
Related Posts
ai-setup
Recall – Persistent Memory for Claude Code via MCP Hooks
Recall gives Claude Code a permanent memory store that survives session restarts and context compaction. Four hooks capture and restore context automatically — with cloud SaaS or self-hosted options.
2/28/2026
dev-tools
AgentMesh – Define AI Agent Teams in YAML
Define multi-agent AI workflows in YAML and run them locally with one command. AgentMesh brings Docker Compose patterns to AI agent orchestration.
5/28/2026
ai-setup
Sentrial – Catch AI Agent Failures Before Your Users Do
YC W26-backed AI agent observability platform. Trace sessions, detect silent regressions, and A/B test prompts in production before failures reach users.
5/28/2026