LogClaw - Open-Source AI SRE That Runs in Your VPC
LogClaw is an Apache 2.0 log intelligence platform that ingests logs via OpenTelemetry, runs signal-based anomaly detection, and auto-files Jira tickets through LLMs you control.
TL;DR
TL;DR: LogClaw is an Apache 2.0 log intelligence platform you can deploy into your own VPC. It pipes logs through OpenTelemetry, runs signal-based anomaly detection (eight failure-type signals, composite z-score scoring), correlates them across traces, and uses an LLM to file deduplicated tickets on Jira, ServiceNow, PagerDuty, or Slack. Critical failures (OOM, panics) trigger in under 100ms.
Source and Accuracy Notes
- Official site: logclaw.ai
- Documentation: docs.logclaw.ai
- Show HN thread: HN item 47353981 (19 points, March 2026)
- License: Apache 2.0 for the self-hosted build
- Managed cloud:
$0.30/GBingested
What Is LogClaw?
LogClaw is an open-source AI SRE that lives inside your infrastructure rather than shipping your logs to a SaaS. It was built by Robel, a former Datadog user who got tired of pager alerts that said “something is wrong” with no actual context. The premise is simple: a SRE agent should ingest your logs, figure out what actually broke, and file a ticket with a real root-cause analysis - not a stack trace dump.
The system runs on Kubernetes, ingests logs through OpenTelemetry, and layers three capabilities on top of the raw stream:
# Core pipeline at a glance
OTel Collector  ->  Kafka (Strimzi, KRaft mode)
                       |
                       v
                 Bridge service (Python)
                 - ETL thread
                 - Anomaly detection thread
                 - OpenSearch indexing thread
                 - Trace correlation thread
                       |
                       +--->  OpenSearch  (logs + dashboards)
                       |
                       +--->  Ticketing Agent  ->  LLM  ->  Jira / PagerDuty / Slack
The pipeline is namespace-isolated per tenant and ships as a single Helm chart, which makes it a fit for teams that already operate multi-tenant clusters.
The Detection Layer
LogClaw is opinionated about what counts as a real incident. Instead of threshold rules (“alert if error_count > 100”), it computes a composite anomaly score from eight explicit failure-type signals:
1. OOM (out-of-memory kills)
2. Process crashes / panics
3. Resource exhaustion (CPU, memory, disk pressure)
4. Dependency failures (downstream service errors)
5. Database deadlocks
6. Timeouts
7. Connection errors
8. Authentication failures
Each signal is then weighted using z-score analysis, blast radius, error velocity, and recurrence rate. The composite score decides whether the event becomes an incident. Critical signals (OOM, panics) bypass the time-window wait and fire within 100ms - useful when a process is thrashing and you need to page on-call before the next 5-minute metric tick.
The founder claims 99.8% detection for critical failures, while filtering noise like validation errors and 404s. That metric is self-reported and worth verifying against your own traffic, but the architecture is sound: it explicitly avoids firing on every 500, which is the failure mode of most homegrown alerting.
The Correlation Layer
Once an anomaly is confirmed, LogClaw does not just file the raw log line. A 5-layer trace correlation engine groups events by traceId, maps service dependencies, tracks error propagation cascades, and computes the blast radius across affected services. The output is a correlated timeline that the ticketing agent can hand to an LLM.
The LLM (your choice of OpenAI, Claude, or local Ollama for fully air-gapped deployments) is then asked to do root-cause analysis on that timeline. The system is explicit that the LLM is not making routing decisions; it is summarizing evidence. The deduplication and routing logic stays in Python.
Setup Workflow
Step 1: Prerequisites
# You'll need
- Kubernetes cluster (1.24+)
- Helm 3.x
- OpenAI / Claude / Ollama API key
# Total deploy time: roughly 10 minutes on a fresh cluster
Step 2: Add the Helm repo and install
helm repo add logclaw https://charts.logclaw.ai
helm repo update

# Create a namespace-isolated tenant
kubectl create namespace logclaw-tenant-1

# Install with default values
helm install logclaw logclaw/logclaw \
  --namespace logclaw-tenant-1 \
  --values values.yaml
Step 3: Configure log ingestion
The default OTel collector is configured to scrape stdout from pods in the same namespace. To ingest from a specific workload, add these annotations to your Deployment:
apiVersion: apps/v1
kind: Deployment
metadata:
  name: petclinic-rest-api
  annotations:
    logclaw.ai/enable: "true"
    logclaw.ai/service-name: "petclinic-rest-api"
spec:
  template:
    metadata:
      annotations:
        logclaw.ai/scrape: "true"
Logs flow from the pod stdout through the OTel collector into Kafka, then into the Bridge service, then into OpenSearch.
Step 4: Wire up the ticketing integration
LogClaw supports Jira, ServiceNow, PagerDuty, OpsGenie, Slack, and Zammad out of the box. The simplest one to start with is Slack, because it requires no service-account setup:
# values.yaml
ticketing:
  provider: "slack"
  channel: "#incidents"
  mention_oncall: "@oncall-sre"
For Jira, you need a service account with project write permission:
ticketing:
  provider: "jira"
  url: "https://your-org.atlassian.net"
  project_key: "OPS"
  auth:
    email: "[email protected]"
    api_token_secret: "jira-token"
Step 5: Configure the LLM layer
For an air-gapped deployment, point LogClaw at a local Ollama:
llm:
  provider: "ollama"
  base_url: "http://ollama.ollama.svc.cluster.local:11434"
  model: "llama3.1:70b"
For OpenAI or Claude, just set the API key and provider:
llm:
  provider: "openai"
  model: "gpt-4o-mini"
  api_key_secret: "openai-key"
Step 6: Watch the first incident roll in
After deployment, you can trigger a test failure to verify the loop:
# From the docs - sends a synthetic OOM event
kubectl exec -n logclaw-tenant-1 deploy/logclaw-bridge -- \
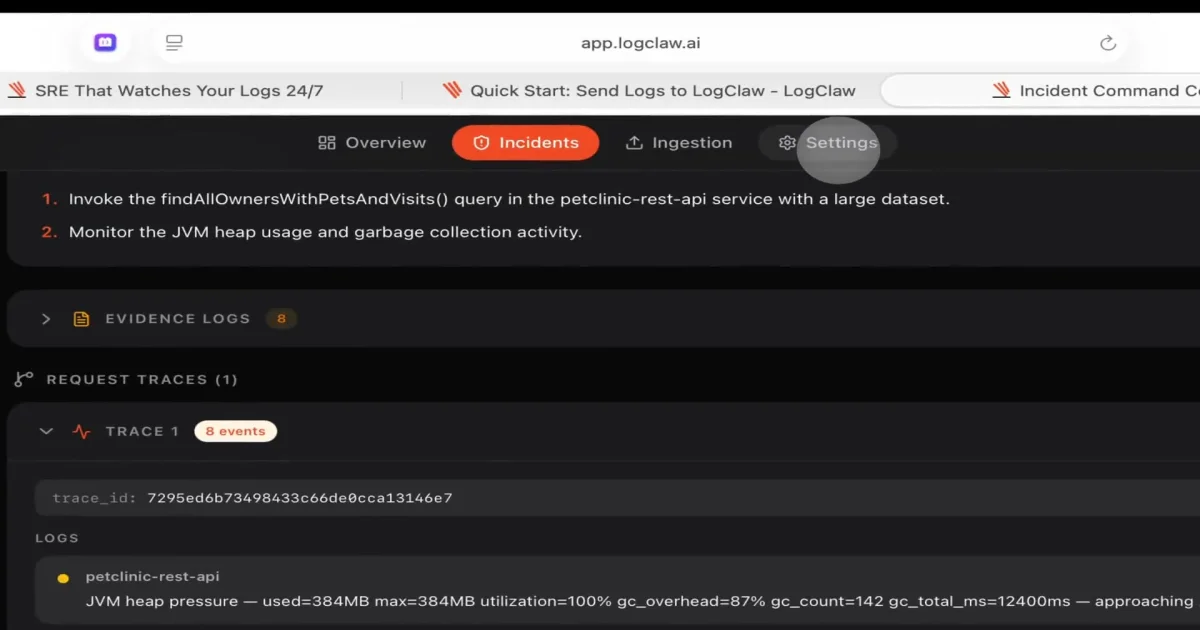
python tools/synthetic_incident.py --type oomYou should see the incident appear in the LogClaw UI within a few seconds, the trace correlation engine group related logs, the LLM produce a root-cause analysis, and a ticket get filed in your configured integration.
Deeper Analysis
What LogClaw Does NOT Do
The author is unusually upfront about scope. From the documentation:
- Metrics and traces are out of scope. LogClaw is logs-only right now. There is no Prometheus or Datadog-style metrics ingestion. Metrics support is on the roadmap.
- The detection layer is signal-based, not deep learning. The composite scoring uses z-scores and heuristics, not an LSTM. It catches 99.8% of critical failures but will not detect subtle performance drift patterns.
- The dashboard is functional but basic. Heavy visualization lives in OpenSearch Dashboards, which LogClaw ships with. Do not expect a Datadog-equivalent UI.
These are real constraints and they matter for capacity planning. If you need a full observability stack, LogClaw is the L and E in ELK plus a ticketing layer, not a Datadog replacement.
Architecture Trade-offs
A few choices worth understanding:
# Why Kafka instead of a direct path?
- Decouples ingestion from analysis, so a slow LLM call
  does not back up log collection.
- Lets you replay the same log stream against multiple
  detection models (e.g., shadow a new scoring version).
- KRaft mode avoids the ZooKeeper dependency.

# Why is the Bridge service Python with 4 threads?
- Simplicity over throughput. Each thread is one concern.
- Trade-off: vertical scaling ceiling around 50K logs/sec
  per tenant. Above that, you scale by adding tenants.
Comparison to Existing Tools
| Tool | Strength | Where LogClaw Differs | |---|---|---| | Datadog Logs | Mature UI, deep integrations | SaaS-only, expensive per-GB, no LLM root-cause | | Grafana Loki | Open-source, cheap | No anomaly detection, you write PromQL | | ELK + ElastAlert | Open-source, well-known | Threshold-based rules, high false positive rate | | Sentry | Excellent for app errors | App-only, not infrastructure | | LogClaw | Open-source, signal-based, LLM RCA | Logs-only, newer project, smaller community |
Practical Evaluation Checklist
Before adopting, run a two-week pilot and verify:
- [ ] Detection precision on your traffic. Inject known bad patterns (synthetic OOMs, dependency timeouts) and check that LogClaw fires within 100ms with the right trace correlation.
- [ ] Noise floor. Validation errors and 404s should not page on-call. Verify the 99.8% critical-failure claim against your own log volume.
- [ ] LLM cost. A noisy system will rack up API calls. Use Ollama for the pilot if cost is a concern.
- [ ] Multi-tenant isolation. Run a second tenant in the same cluster and confirm there is no cross-tenant data leakage.
- [ ] Helm upgrade story. Upgrades should not require a downtime window. Run a
helm upgradeagainst your pilot cluster before committing. - [ ] Backpressure behavior. What happens when Kafka fills up? Does the OTel collector drop logs, block, or buffer?
Security Notes
LogClaw runs in your VPC, so the log data does not leave your infrastructure. The LLM call is the one exception: if you use OpenAI or Claude, the correlated timeline and root-cause prompt do get sent to the third-party API. For sensitive workloads, use the Ollama integration with a local model. The Helm chart ships with NetworkPolicies that restrict egress to the LLM endpoint only, but you should verify those are not relaxed in your values.yaml.
The LLM has no write access to your infrastructure. It produces text that is filed as a ticket - it does not execute remediations, run kubectl, or call external systems. This is a deliberate choice and worth keeping.
FAQ
Q: Is LogClaw a Datadog replacement? A: No, it is logs-only. There is no metrics or traces ingestion, and the UI is intentionally minimal. The strong fit is teams that want a self-hosted log intelligence layer with an LLM ticketing hook, not a full observability platform.
Q: Can I use LogClaw without an LLM?
A: Yes, the detection and correlation layers are LLM-free. The LLM is only used for the root-cause analysis text in the ticket. Set the provider to none in values.yaml and the system will file tickets with the raw correlated timeline.
Q: How does the LLM cost scale? A: It scales with the number of confirmed incidents, not with log volume. A noisy system will be expensive regardless of which LLM you use, so tune the composite scoring first.
Q: What is the license?
A: Apache 2.0 for the self-hosted build. The managed cloud version is a separate commercial product priced at $0.30/GB ingested.
Q: Can I deploy LogClaw outside Kubernetes? A: No, the Helm chart assumes K8s. The author has not published a docker-compose or bare-metal path.
Q: How does LogClaw handle multi-region or multi-cluster deployments? A: Each cluster runs its own tenant. There is no built-in federation. If you need a global view, point OpenSearch Dashboards at multiple remote clusters.
Q: What is the upgrade story?
A: Standard Helm. Run helm upgrade and the migration runs in-place. The author recommends reading the release notes for breaking changes in the values.yaml schema.
Conclusion
LogClaw is a focused tool: it ingests logs, detects real anomalies with a transparent scoring model, correlates them across traces, and files a deduplicated ticket with an LLM-generated root-cause analysis. It is not trying to be Datadog, Grafana, or Sentry. The Apache 2.0 license, single-Helm-chart deploy, and explicit “logs only” scope make it a strong fit for teams that want an AI SRE without shipping logs to a third-party SaaS. Start with the Ollama integration for the pilot, verify the detection precision on your own traffic, and treat the managed cloud as an escape hatch if the operational burden grows.
Related Posts
dev-tools
AgentMesh – Define AI Agent Teams in YAML
Define multi-agent AI workflows in YAML and run them locally with one command. AgentMesh brings Docker Compose patterns to AI agent orchestration.
5/28/2026
ai-setup
Sentrial – Catch AI Agent Failures Before Your Users Do
YC W26-backed AI agent observability platform. Trace sessions, detect silent regressions, and A/B test prompts in production before failures reach users.
5/28/2026
ai-setup
IonRouter – Fast Low-Cost AI Inference API
IonRouter is a YC W26 inference API routing open-source and fine-tuned models via an OpenAI-compatible endpoint, built on a C++ runtime optimized for GH200.
5/28/2026