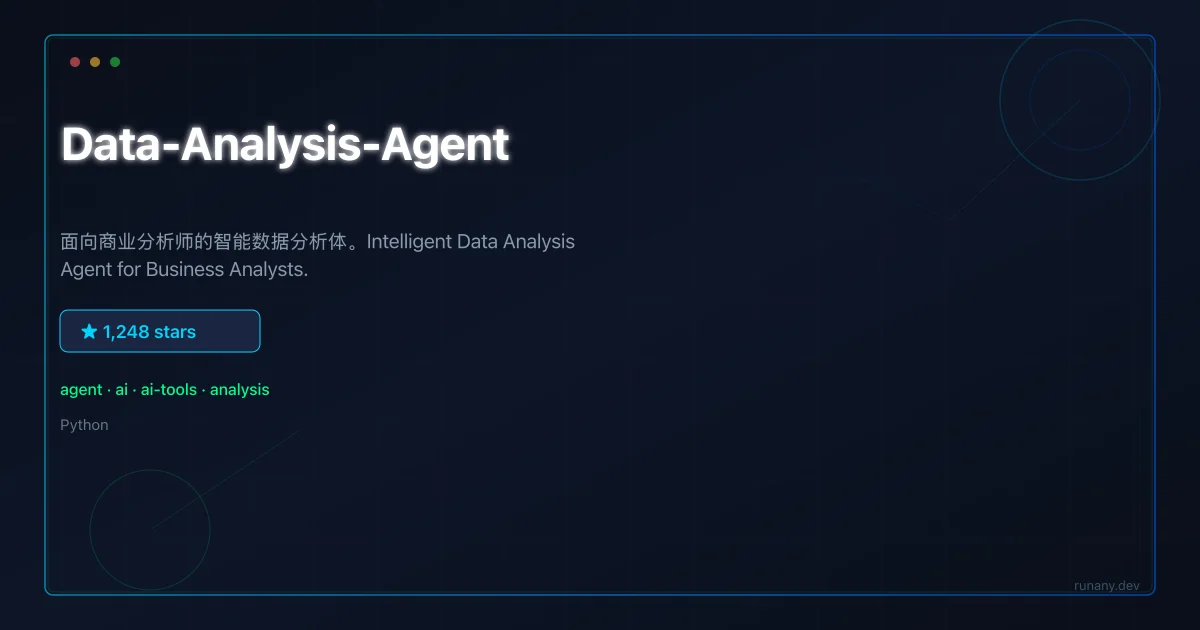
Data Analysis Agent – AI Data Analyst for Business Users
An AI data analysis agent for business users. Upload CSV, connect SQL databases, and describe what you want to find. Charts, stats, and reports generated.
TL;DR
TL;DR: Data Analysis Agent is an AI-powered data analysis tool for business users. Upload CSV or Excel files, connect SQL databases, and describe what you want to find — charts, statistical models, and reports are generated automatically. Supports slash commands for specialized analysis modes.
Source and Accuracy Notes
- Repository: Zafer-Liu/Data-Analysis-Agent (1,200+ stars, Apache 2.0 license)
- Tech stack: Python, Streamlit, DuckDB, Plotly, ECharts
- Interface: English and Chinese
What Is Data Analysis Agent?
Data Analysis Agent is a web-based AI tool that lets business analysts explore data without writing code. Upload your data (CSV, Excel) or connect a SQL database, and describe what you want to analyze in natural language. The agent generates SQL queries, statistical models, and interactive visualizations automatically.
The tool supports three data sources:
- File upload: CSV and Excel files with automatic encoding detection and schema inference
- SQL databases: Connect MySQL, PostgreSQL, or SQLite with connection strings
- Knowledge base: Persistent data storage for frequently used datasets with scheduled updates
Repo-Specific Setup Workflow
Step 1: One-Click Install
curl -fsSL https://raw.githubusercontent.com/Zafer-Liu/Data-Analysis-Agent/main/install.sh | shAfter installation:
data-analysis-agentThe web UI opens at http://localhost:8501.
Step 2: Manual Install
git clone https://github.com/Zafer-Liu/Data-Analysis-Agent.git
cd Data-Analysis-Agent
pip install -r requirements.txt
python app.py
Step 3: Configure LLM
In the sidebar settings panel, enter:
API Key: sk-...
Base URL: https://api.deepseek.com (or your provider)
Model: deepseek-chat / gpt-4.1 / claude-sonnet
A connection test indicator confirms the model is reachable.
Step 4: Upload and Analyze
Upload a CSV file or connect a database. Describe what you want:
"Show sales trend over the last 12 months"
"Which region has the highest profit margin?"
"Run K-Means clustering on customer segments"
The agent generates SQL, visualizations, and analysis notes.
Deeper Analysis
The architecture uses DuckDB as the query engine — a deliberate choice over SQLite for its analytical performance. DuckDB processes millions of rows in seconds on a laptop, which means the agent stays responsive even with large datasets without requiring a server-side database.
Slash commands provide specialized analysis modes that go beyond basic query generation:
| Command | Purpose |
|---|---|
| /chart | Force chart-first mode — visualization before text |
| /sql | Direct SQL execution with preview |
| /tree | Decision tree analysis |
| /kmeans | K-Means clustering |
| /report | Export Word/PDF report |
| /ppt | Export PowerPoint presentation |
| /winsorize | Handle outliers via Winsorization |
The v4.0 release (May 2026) added a redesigned sidebar with status indicators, model connection testing, and report-style agent output formatting. DuckDB replaced SQLite as the default engine, and a time series analysis module was added with Prophet, SARIMA, ARIMA, VAR, and GRU model support.
Practical Evaluation Checklist
- [ ] CSV, Excel, MySQL, PostgreSQL, SQLite sources
- [ ] DuckDB engine for analytical performance
- [ ] 15 slash commands for specialized analysis
- [ ] Time series module with 5 model types
- [ ] Export to Word, PDF, and PowerPoint
- [ ] Apache 2.0 license
Security Notes
SQL database connections use raw connection strings — secure them appropriately. The tool generates and executes SQL queries automatically; test generated queries on non-production databases first. LLM API keys are stored in the browser’s local settings. For production deployments, run behind a reverse proxy with authentication.
FAQ
Q: How is this different from asking Claude to analyze data? A: Claude can write analysis code, but Data Analysis Agent provides a persistent web UI, handles file uploads and SQL connections, supports slash commands for repeatable analysis flows, and generates formatted reports — a dedicated interface rather than a chat window.
Q: What’s the largest dataset it can handle? A: DuckDB handles millions of rows on modest hardware. For datasets over 10M rows, consider a dedicated database server.
Q: Can I use it with local LLMs? A: Yes — configure any OpenAI-compatible endpoint, including Ollama running locally.
Q: Does it support non-Chinese/English datasets? A: The LLM handles multilingual prompts. Column names and data values in other languages should work with appropriate LLM models.
The time series module added in v4.0 covers the five most commonly used forecasting models. Prophet (Meta’s forecasting tool) handles business data with seasonality and holiday effects, SARIMA covers classical statistical time series with seasonal components, ARIMA provides baseline non-seasonal forecasting, VAR handles multivariate time series where multiple variables influence each other, and GRU (Gated Recurrent Unit) offers deep learning-based forecasting for complex patterns. The agent selects the appropriate model based on data characteristics — seasonality detection, trend strength, and data frequency — and explains its choice in the analysis output.
The DuckDB migration in v4.0 was a significant performance improvement. DuckDB is a columnar analytical database that runs in-process (no server needed) and is optimized for OLAP workloads. Loading a 10-million-row CSV and running aggregations now takes seconds instead of minutes. The agent can perform complex multi-table joins, window functions, and subqueries that would be impractical in SQLite. For datasets that exceed memory, DuckDB spills to disk automatically, so the 2GB CSV limit mentioned in the docs is conservative — larger datasets work with graceful degradation in performance.
The report export system generates formatted documents from session analysis. Word exports include the generated charts embedded as images, the analysis narrative, and a data summary table. PDF exports use a template system with configurable headers, footers, and branding. PowerPoint exports convert charts into editable slide objects and analysis text into bullet-point notes — designed for quickly creating data-driven presentations without manual slide building. All export formats preserve the original data for reproducibility.
The knowledge base feature enables persistent data management for frequently used datasets. You can upload a dataset once, schedule automatic refresh (daily, weekly), and the agent maintains history with timestamps. When you ask a question, the agent automatically pulls from the latest refresh. This eliminates the repetitive upload workflow for regular reporting — upload your monthly sales data once, set a schedule, and the agent keeps the analysis current without manual intervention.
Conclusion
Data Analysis Agent fills the gap between spreadsheet tools (limited analytics) and programming-based analysis (steep learning curve). The slash command system and DuckDB backend make it practical for real workloads, not just demos. For business analysts who want AI-assisted data exploration without learning SQL or Python, this is a focused, capable tool.
Related Posts
dev-tools
Automotive Skills Suite for AI Engineering
Evaluate Automotive Skills Suite for APQP, ASPICE, HARA, safety-plan, and DIA workflows with setup notes, governance risks, and SME review guidance.
5/28/2026
dev-tools
awesome-agentic-ai-zh Roadmap Guide
Explore awesome-agentic-ai-zh as a Chinese agentic AI learning roadmap, with setup notes, track selection, study workflow, and evaluation guidance.
5/28/2026
dev-tools
Baguette iOS Simulator Automation Guide
Set up Baguette for iOS Simulator automation, web dashboards, device farms, gesture input, streaming, and camera testing with Xcode caveats.
5/28/2026